How to automatically detect memory leaks on CI/CD using UI tests

Helm Pro yearly subscribers now get a 30% discount on RocketSim thanks to contingent pricing on the App Store.
Back in WWDC21 and with the launch of Xcode 13, Apple introduced a new xcodebuild option that generates a memory graph whenever a UI test measuring XCTMemoryMetrics fails.
The flag is called enablePerformanceTestsDiagnostics, is only available in xcodebuild and not in Xcode and only generates memory graphs for failed UI tests when the tests run on a physical device and not on the simulator.
While this feature went seemingly unnoticed by many developers, when used correctly, it can be a powerful tool to automatically detect memory leaks in your Apple apps on CI/CD environments.
Writing a memory usage UI test
The first thing we have to do is to write a UI test that measures the memory usage of our app with an XCTMemoryMetric:
import XCTest

final class AutomatedTestingUITests: XCTestCase {
    func testMemoryLeaks() {
        let app = XCUIApplication()

        let options = XCTMeasureOptions()
        options.invocationOptions = [.manuallyStart]

        measure(metrics: [XCTMemoryMetric(application: app)], options: options) {
            app.launch()

            startMeasuring()

            for _ in (0...3) {
                let button = app.buttons["Cause a memory leak"].firstMatch
                if button.waitForExistence(timeout: 5) {
                    button.tap()

                    let backButton = app.navigationBars.buttons.element(boundBy: 0)
                    if backButton.waitForExistence(timeout: 5) {
                        backButton.tap()
                    }
                }
            }
        }
    }
}
For the sake of simplicity and showing how to detect a memory leak using UI tests, I created a simple app with a button that navigates to a screen and introduces a memory leak in the process.
If we now run the UI test in Xcode, we will see a gray indicator next to the measure method’s invocation stating that we have not yet set a baseline measurement for the test. As the purpose of this test is to generate a memory graph and we want the measurement to always fail, we will set the baseline to a very low value that will always be exceeded:
Generating a memory graph
Now that we have a test that always fails, we need to invoke it from the command line using xcodebuild and the enablePerformanceTestsDiagnostics flag so that it generates a memory graph for us:
xcodebuild test \
    -project AutomatedTesting.xcodeproj \
    -scheme AutomatedTesting \
    -destination "platform=iOS,name=Pol Piella Abadia's iPhone" \
    -enablePerformanceTestsDiagnostics YES \
    -derivedDataPath ./derived_data \
    -resultBundlePath TestResults
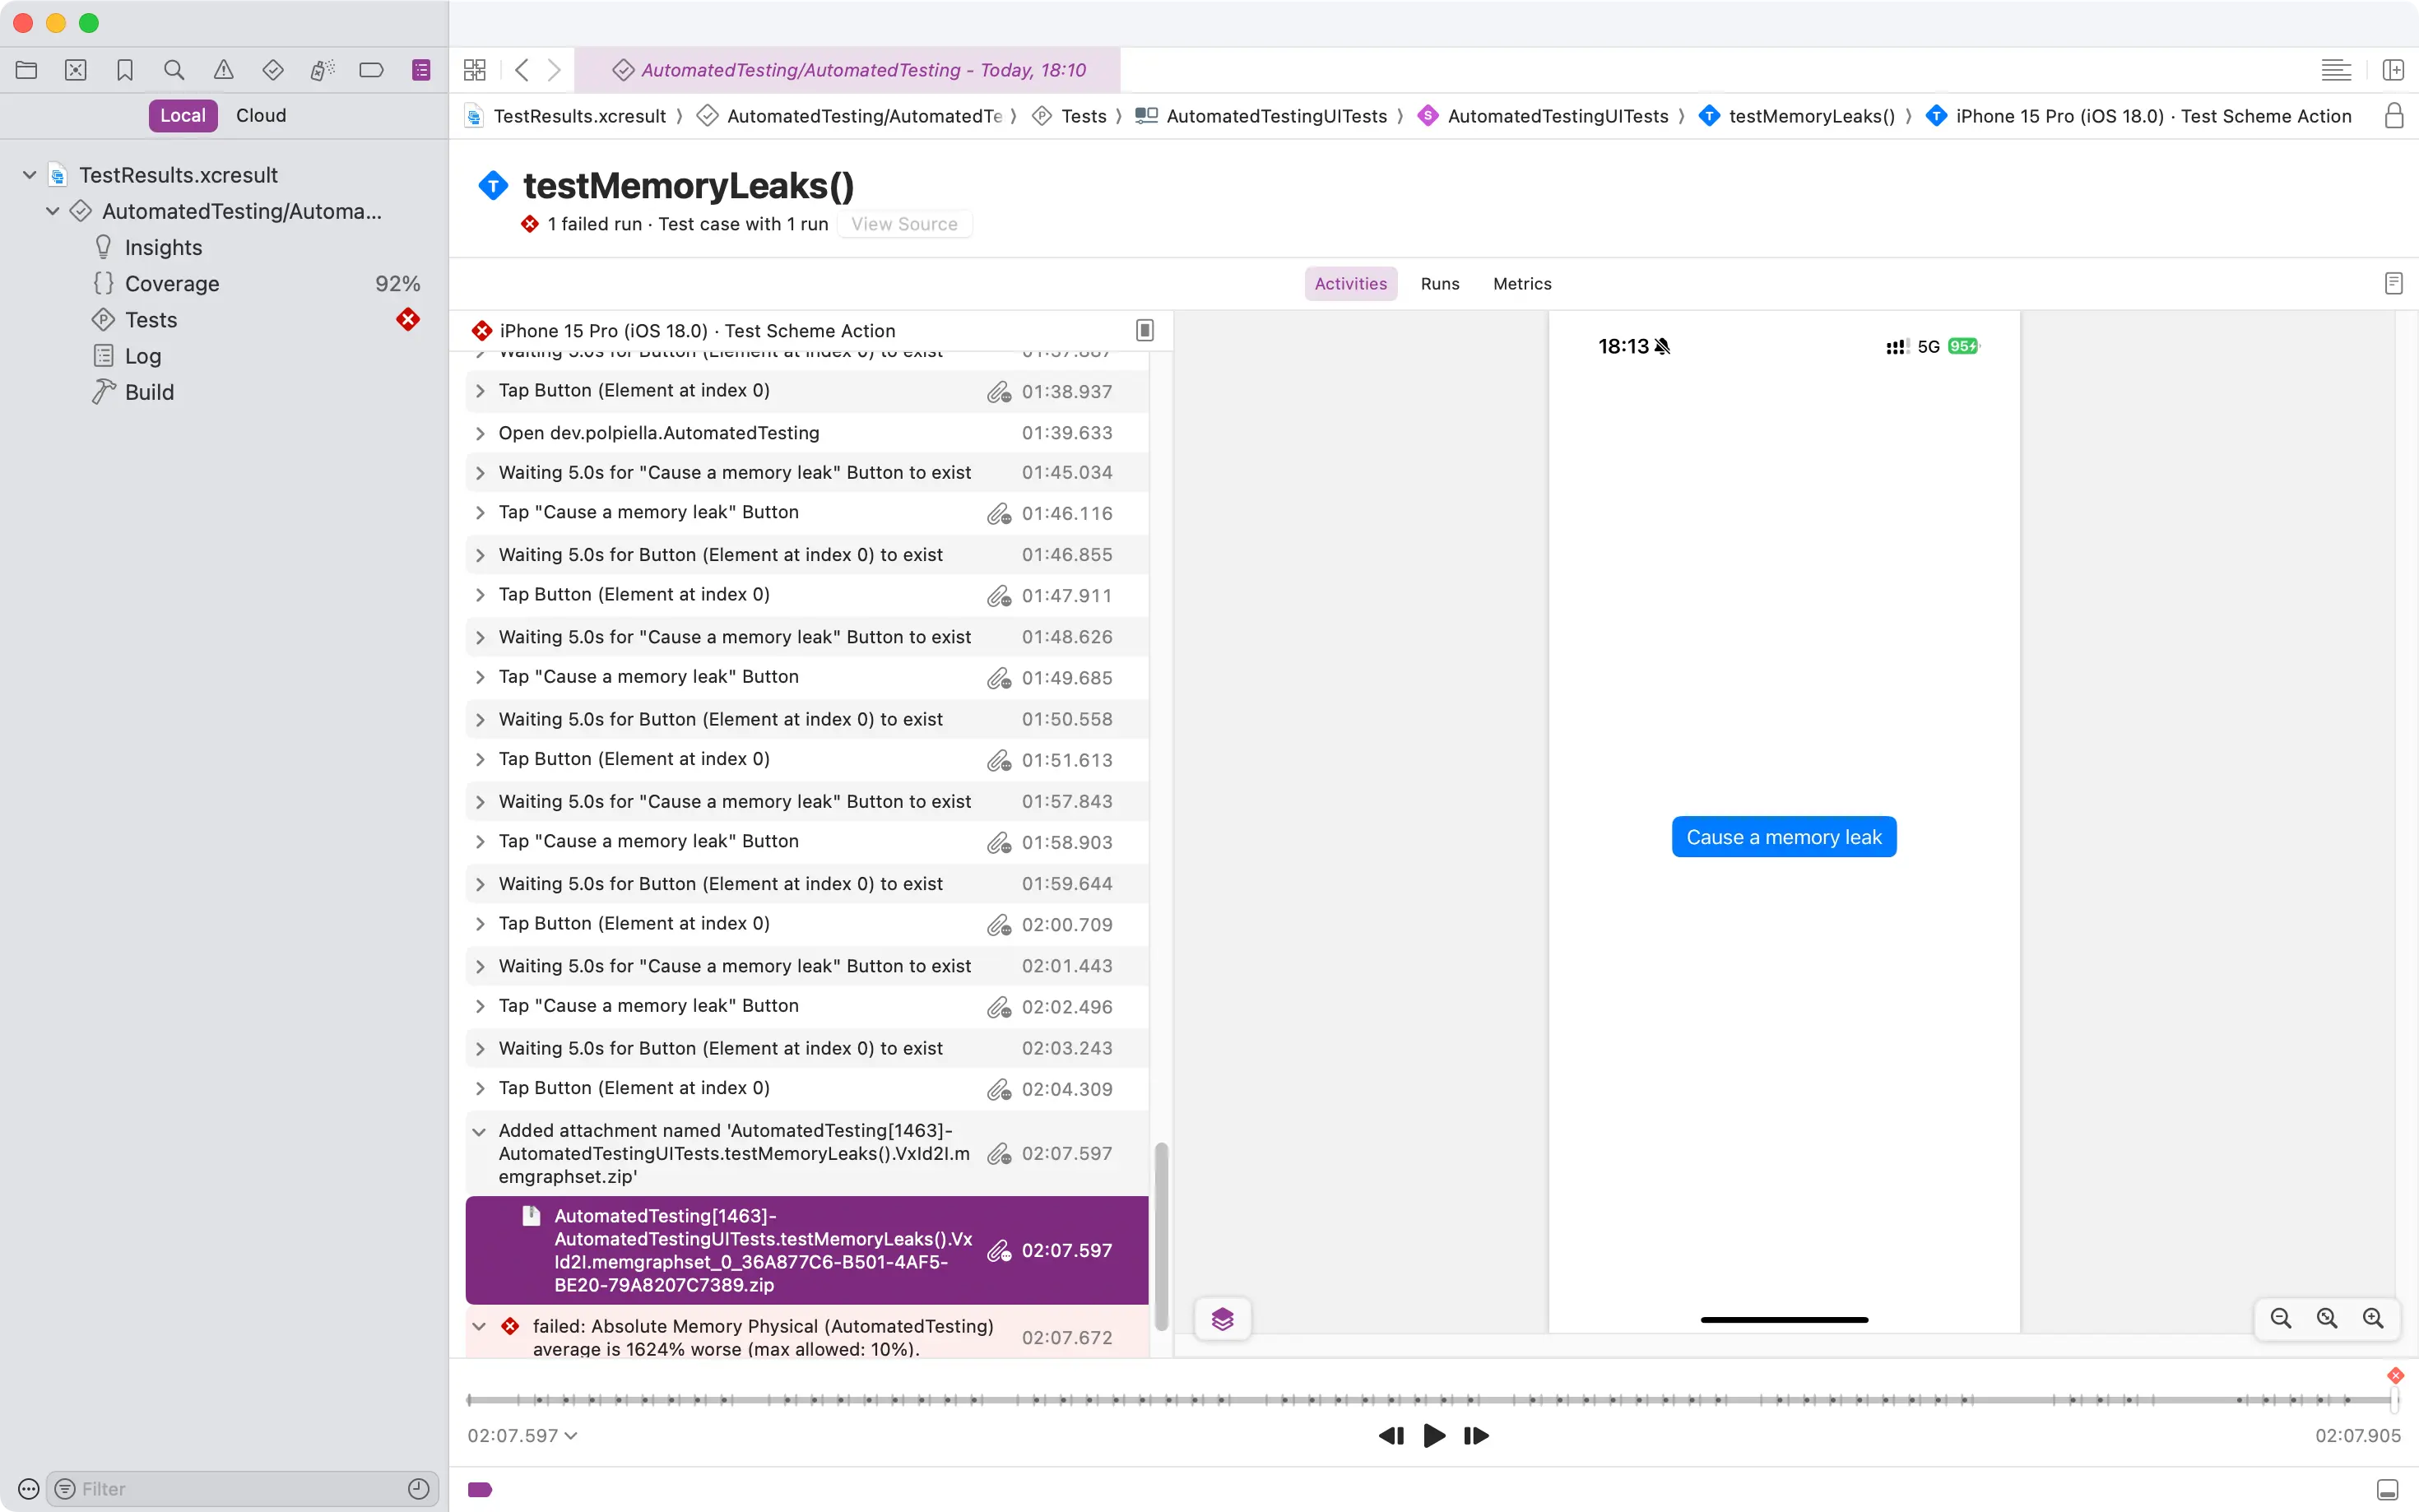
As we provided a custom output path for the .xcresult bundle, we can just find it in the same directory we invoked the command from with the name TestResults. When we open the bundle in Xcode, we see that the test failed and that a memory graph was generated:

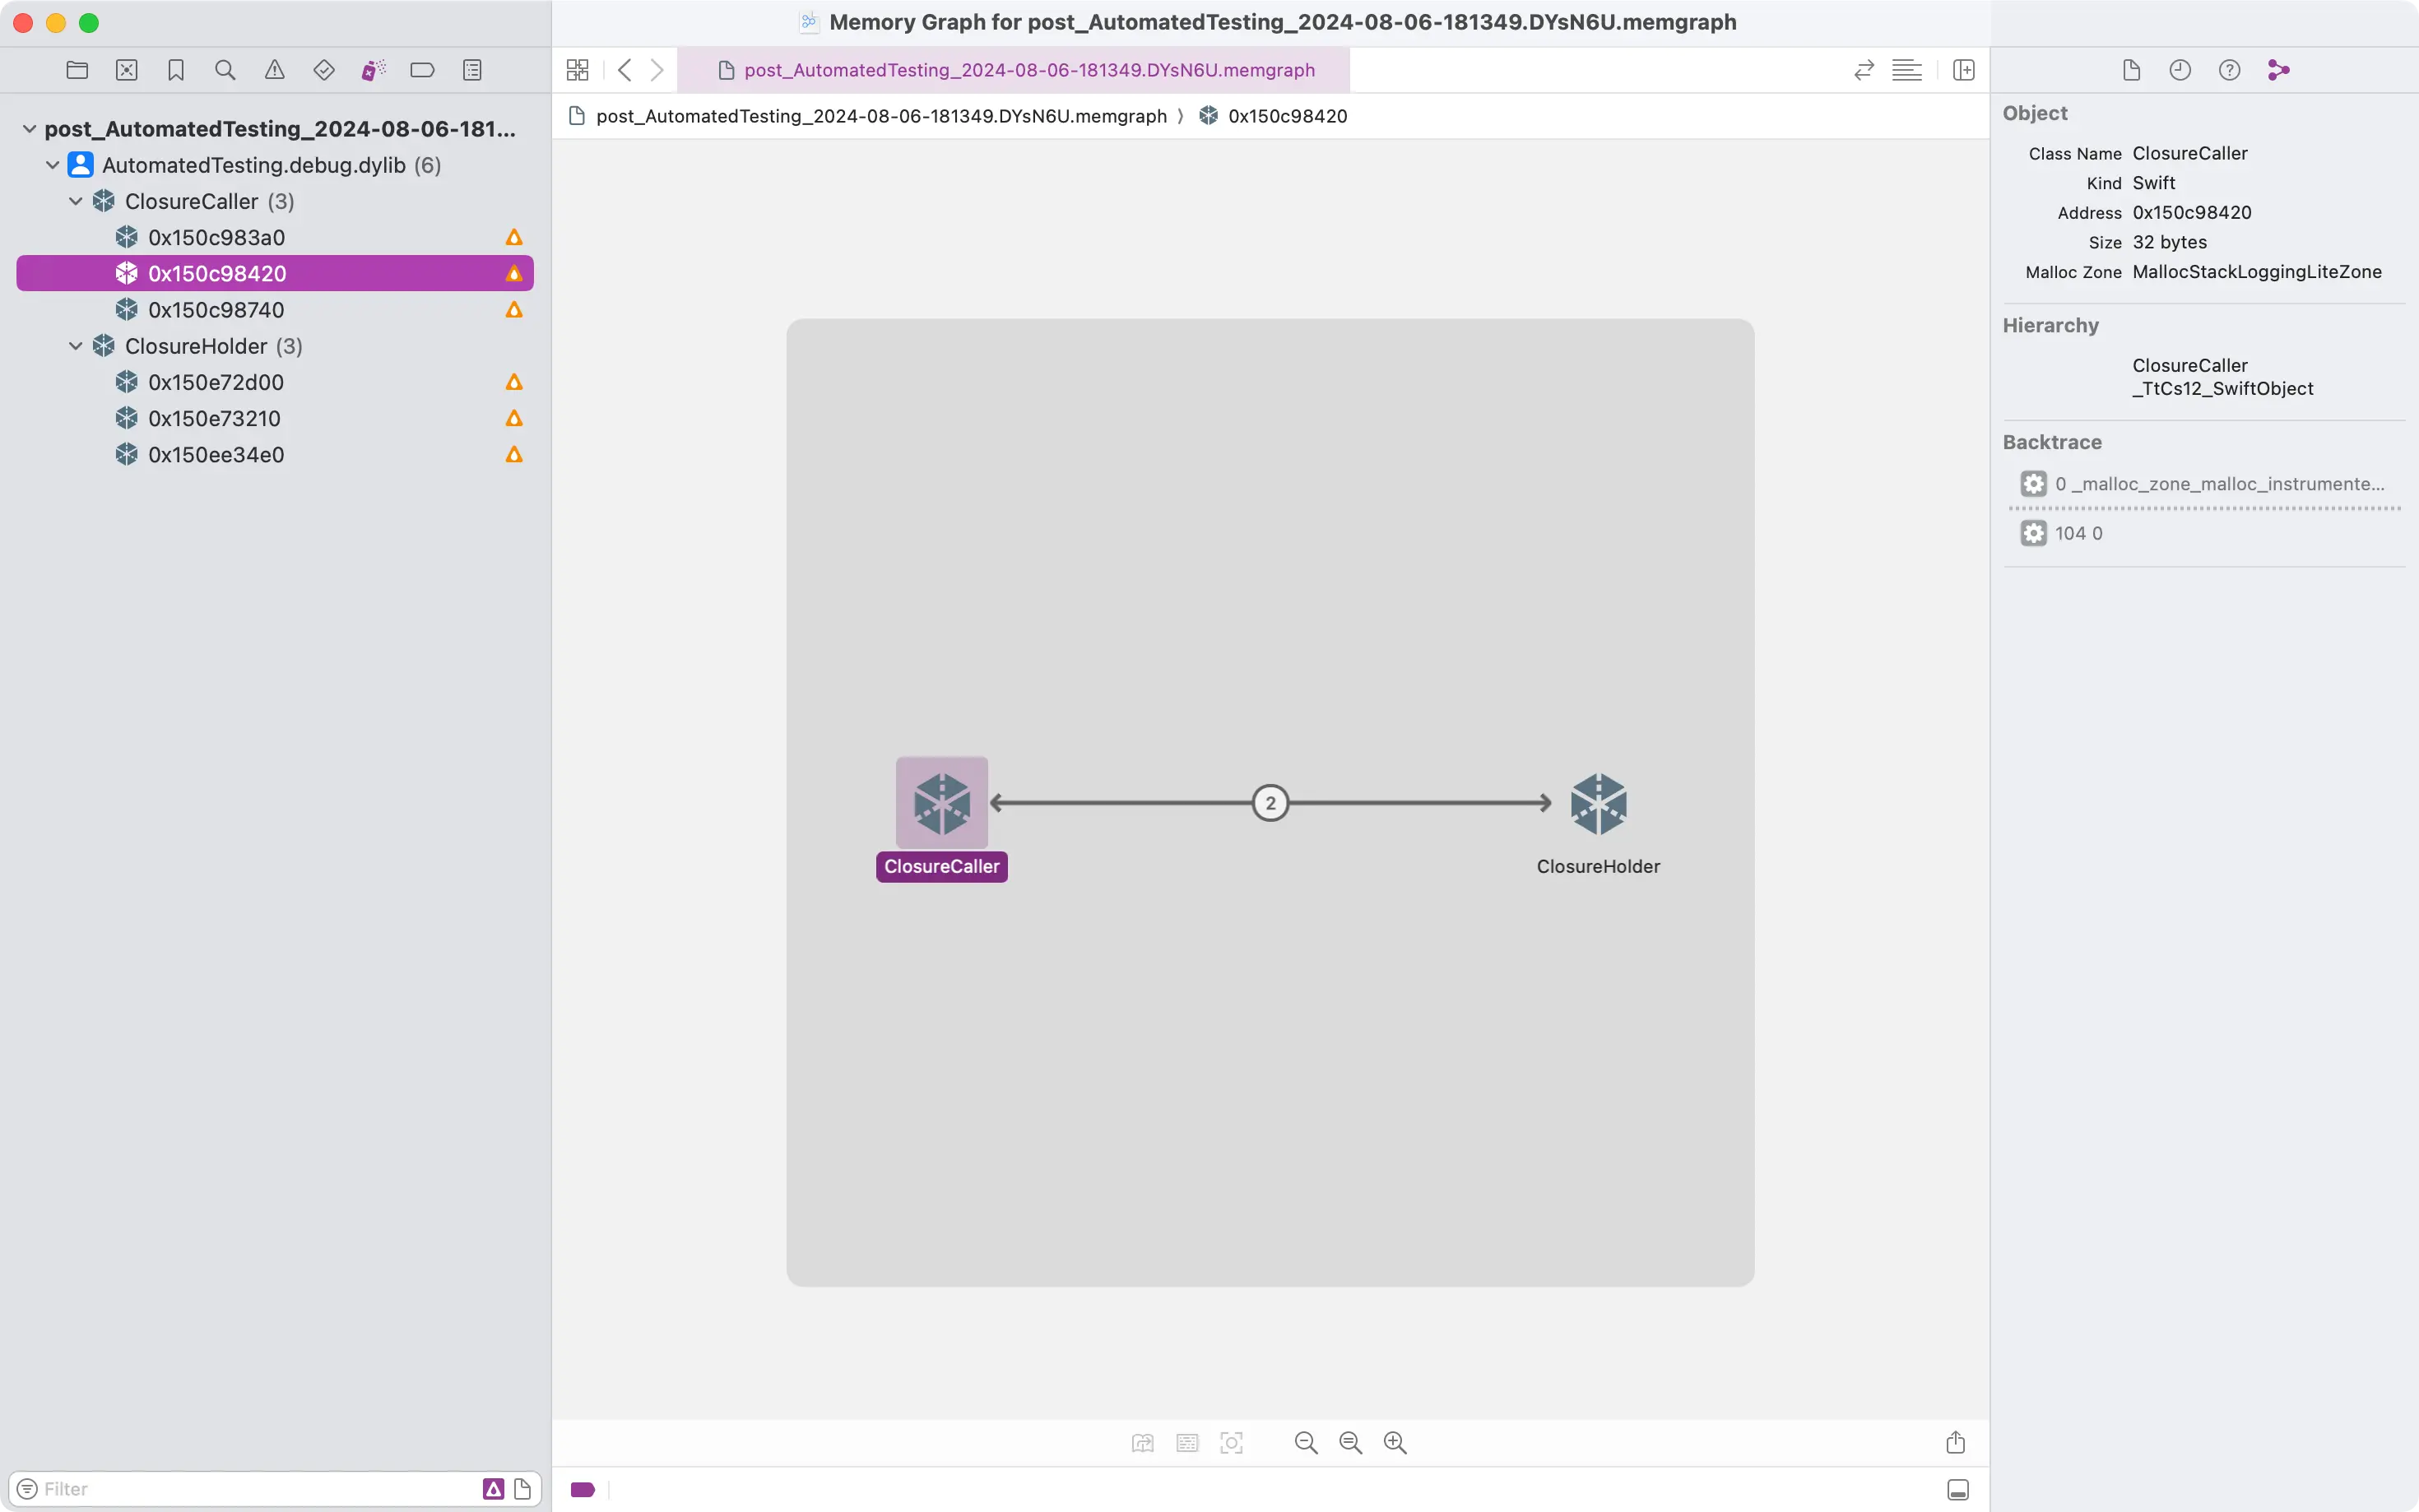
Upon inspection of the memory graph, we can in fact see that the app has numerous memory leaks:

Parsing the result bundle and memory graph
Now that we have a way of generating memory graphs for our UI tests, we can create a small command-line tool that programmatically extracts the memory graph from the .xcresult bundle and checks its contents for memory leaks.
Let’s start by creating a Swift Package with a single executable target and a few dependencies that will help us handle user input, parse the contents of the .xcresult bundle and execute shell commands:
// swift-tools-version: 6.0

import PackageDescription

let package = Package(
    name: "XCLeaks",
    platforms: [
        .macOS(.v13)
    ],
    dependencies: [
        .package(url: "https://github.com/apple/swift-argument-parser.git", exact: "1.5.0"),
        .package(url: "https://github.com/davidahouse/XCResultKit.git", exact: "1.2.0"),
        .package(url: "https://github.com/JohnSundell/ShellOut.git", exact: "2.3.0")
    ],
    targets: [
        .executableTarget(
            name: "XCLeaks",
            dependencies: [
                .product(name: "ArgumentParser", package: "swift-argument-parser"),
                .product(name: "XCResultKit", package: "XCResultKit"),
                .product(name: "ShellOut", package: "ShellOut")
            ]
        ),
    ]
)
I am not going to go into detail about how to use the XCResultKit library to export attachments as I have previously written an article that covers the topic in great detail.
Let’s now write the main file of our executable that will parse the contents of the .xcresult bundle and check for memory leaks:
import Foundation
import ArgumentParser
import XCResultKit
import ShellOut

@main
struct XCLeaks: ParsableCommand {
    // 1
    @Argument(help: "The path to an `.xcresult` bundle")
    var bundle: String

    func run() throws {
        guard let url = URL(string: bundle) else { return }
        // 2
        let result = XCResultFile(url: url)

        guard let invocationRecord = result.getInvocationRecord() else { return }

        // 3
        let testBundles = invocationRecord
            .actions
            .compactMap { action -> ActionTestPlanRunSummaries? in
                guard let id = action.actionResult.testsRef?.id, let summaries = result.getTestPlanRunSummaries(id: id) else {
                    return nil
                }

                return summaries
            }
            .flatMap(\.summaries)
            .flatMap(\.testableSummaries)

        let allFailingTests = testBundles
            .flatMap(\.tests)
            .flatMap(\.subtestGroups)
            .flatMap(\.subtestGroups)
            .flatMap(\.subtests)
            .filter { $0.testStatus.lowercased() == "failure" }

        // 4
        let memoryGraphAttachments = allFailingTests
            .compactMap { test -> ActionTestSummary? in
                guard let id = test.summaryRef?.id else { return nil }

                return result.getActionTestSummary(id: id)
            }
            .flatMap(\.activitySummaries)
            .filter { $0.title.contains("Added attachment named") && $0.title.contains(".memgraphset.zip") }
            .flatMap(\.attachments)

        // 5
        for attachment in memoryGraphAttachments {
            // 6
            let url = URL.temporaryDirectory
            let filePath = url.appending(path: attachment.filename ?? "")
            result.exportAttachment(attachment: attachment, outputPath: url.path(percentEncoded: false))
            // 7
            try shellOut(
                to: "tar",
                arguments: [
                    "-zxvf",
                    "\"\(filePath.path(percentEncoded: false))\"",
                    "-C",
                    url.path(percentEncoded: false)
                ]
            )

            // 8
            guard let unzipped = (filePath.path(percentEncoded: false) as NSString)
                .deletingPathExtension
                .split(separator: "_")
                .first else {
                return
            }

            let unzippedAndEscaped = String(unzipped)
                .replacingOccurrences(of: "(", with: "\\(")
                .replacingOccurrences(of: ")", with: "\\)")
                .replacingOccurrences(of: "[", with: "\\[")
                .replacingOccurrences(of: "]", with: "\\]")

            // 9
            do {
                try shellOut(to: "leaks", arguments: ["\(unzippedAndEscaped)/post_*"])
                print("✅ No leaks found!")
            } catch let error as ShellOutError {
                let regex = /(?<numberOfLeaks>\d+)\s+leaks for/
                if let output = try? regex.firstMatch(in: error.output) {
                    print("❌ Found \(output.numberOfLeaks) leaks")
                    exit(1)
                } else {
                    print("✅ No leaks found!")
                }
            } catch let error {
                print("🛑 Something else went wrong: \(error)")
            }
        }
    }
}
A lot is going on in the code above, so let’s break it down:
- We define a command line argument that will allow users to pass the path to an
.xcresultbundle. - We create an instance of
XCResultFilewith the URL of the.xcresultbundle and extract the list of invocations from which we will find the failing tests. - We extract the failing tests from the invocations.
- We extract the memory graph attachment objects from the failing tests.
- We iterate over the memory graph attachments.
- We export the memory graph attachment to a temporary directory.
- We unzip the memory graph attachment. We are using
ShellOutto call thetarexecutable from the command line and unzip the file. We unzip the file to the same directory as the attachment. - We extract the name of the unzipped file escaping any special characters that might be present in the name.
- We run the
leakscommand line tool to read the contents of the memory graph. Theleakstool fails if the memory graph contains any leaks, so we catch the error and then parse the output with a regular expression to extract the number of leaks found and exit with an error.
Putting it all together
Now that we have everything we need, let’s put the pieces together and see how we would detect memory leaks in a CI/CD environment:
#!/bin/bash

set -e

function test {
    xcodebuild test \
        -project AutomatedTesting.xcodeproj \
        -scheme AutomatedTesting \
        -destination "platform=iOS,name=Pol Piella Abadia’s iPhone" \
        -enablePerformanceTestsDiagnostics YES \
        -derivedDataPath ./derived_data \
        -resultBundlePath TestResults
}

function leaks {
    swift run \
        --package-path xcleaks/ \
        XCLeaks \
        $(pwd)/TestResults.xcresult
}

test || leaks
The command above will make sure that the memory graph is inspected whenever the UI test fails and will make the CI/CD pipeline fail only if memory leaks are found ❌.