How to profile your app's performance and Main Thread usage with Instruments and os_signposts
Helm Pro yearly subscribers now get a 30% discount on RocketSim thanks to contingent pricing on the App Store.
Profiling your application and identifying areas where you can optimize your app’s performance is crucial to ensure a smooth experience for your users. As an Apple developer, it is crucial that you are familiar with the tools that Apple provides to perform these tasks.
Instruments is an app that is part of Xcode’s suite of tools that allows developers to profile their apps for things such as memory footprint, CPU usage or animation hitches, and it plays a crucial role in identifying performance bottlenecks in your app.
In this article, I will be showing you how I use the time profiler instrument to check Main Thread usage and optimize my app’s performance.
Launching instruments
The first step to analyze Main Thread usage in your application using the time profiler instrument is to choose the scheme you’d like to profile in Xcode and select the profile option from the product menu in Xcode’s toolbar or execute the same command with the ⌘ + I keyboard shortcut.
This command will open the Instruments app and prompt you to choose a profiling template. In this article, we will use the Time Profiler template, but I would encourage you to explore the rest and pick the one that best suits your needs.
Recording a trace
Once you have a new window open in Instruments, you will be able to start recording a trace session by clicking the red record button in the top left corner of the window.
This will launch the selected application, which should be the scheme you built for profiling in Xcode, ready for you to interact with it. At this point, you can start navigating to the area of the app you are interested in profiling:
Once you have performed all interactions and visited all the areas of your app you are interested in profiling, you can stop the recording by clicking the stop button in the top left corner of the window.
⚠️ Some issues you might encounter
There are a couple of common issues that you might come across when recording a trace and, in this section, I will show you how to get around them.
The data volume is too high
If you see that the trace stops recording data and shows a warning saying that the data volume is too high for a recording mode of ‘Immediate’, you will need to change the mode in the recording settings to either ‘Deferred’ or ‘Windowed’.
One thing you need to know is that in both these modes you will lose the ability to see the data being logged in real-time.
To change the recording mode, long-press the record button, select the ‘Recording Options’ menu item, expand the ‘Global Options’ section and change the ‘Recording Mode’ to ‘Deferred’ or ‘Last x seconds’.
No symbol names on Xcode 15.3
If you are using Xcode 15.3, you might notice that the symbol names are not being displayed in the trace’s call stack information and you will only be able to see memory addresses:
This issue makes the results from the recording incredibly hard to parse and analyze. The only mode that seems to load symbols correctly is the ‘Deferred’ mode, which is the one I have used in this article.
Inspecting the trace
Once you finish recording, you will be able to inspect the trace in Instruments. The time profiler offers a lot of information about the performance of your app, but for this article, we will be focusing on thread usage and hangs:
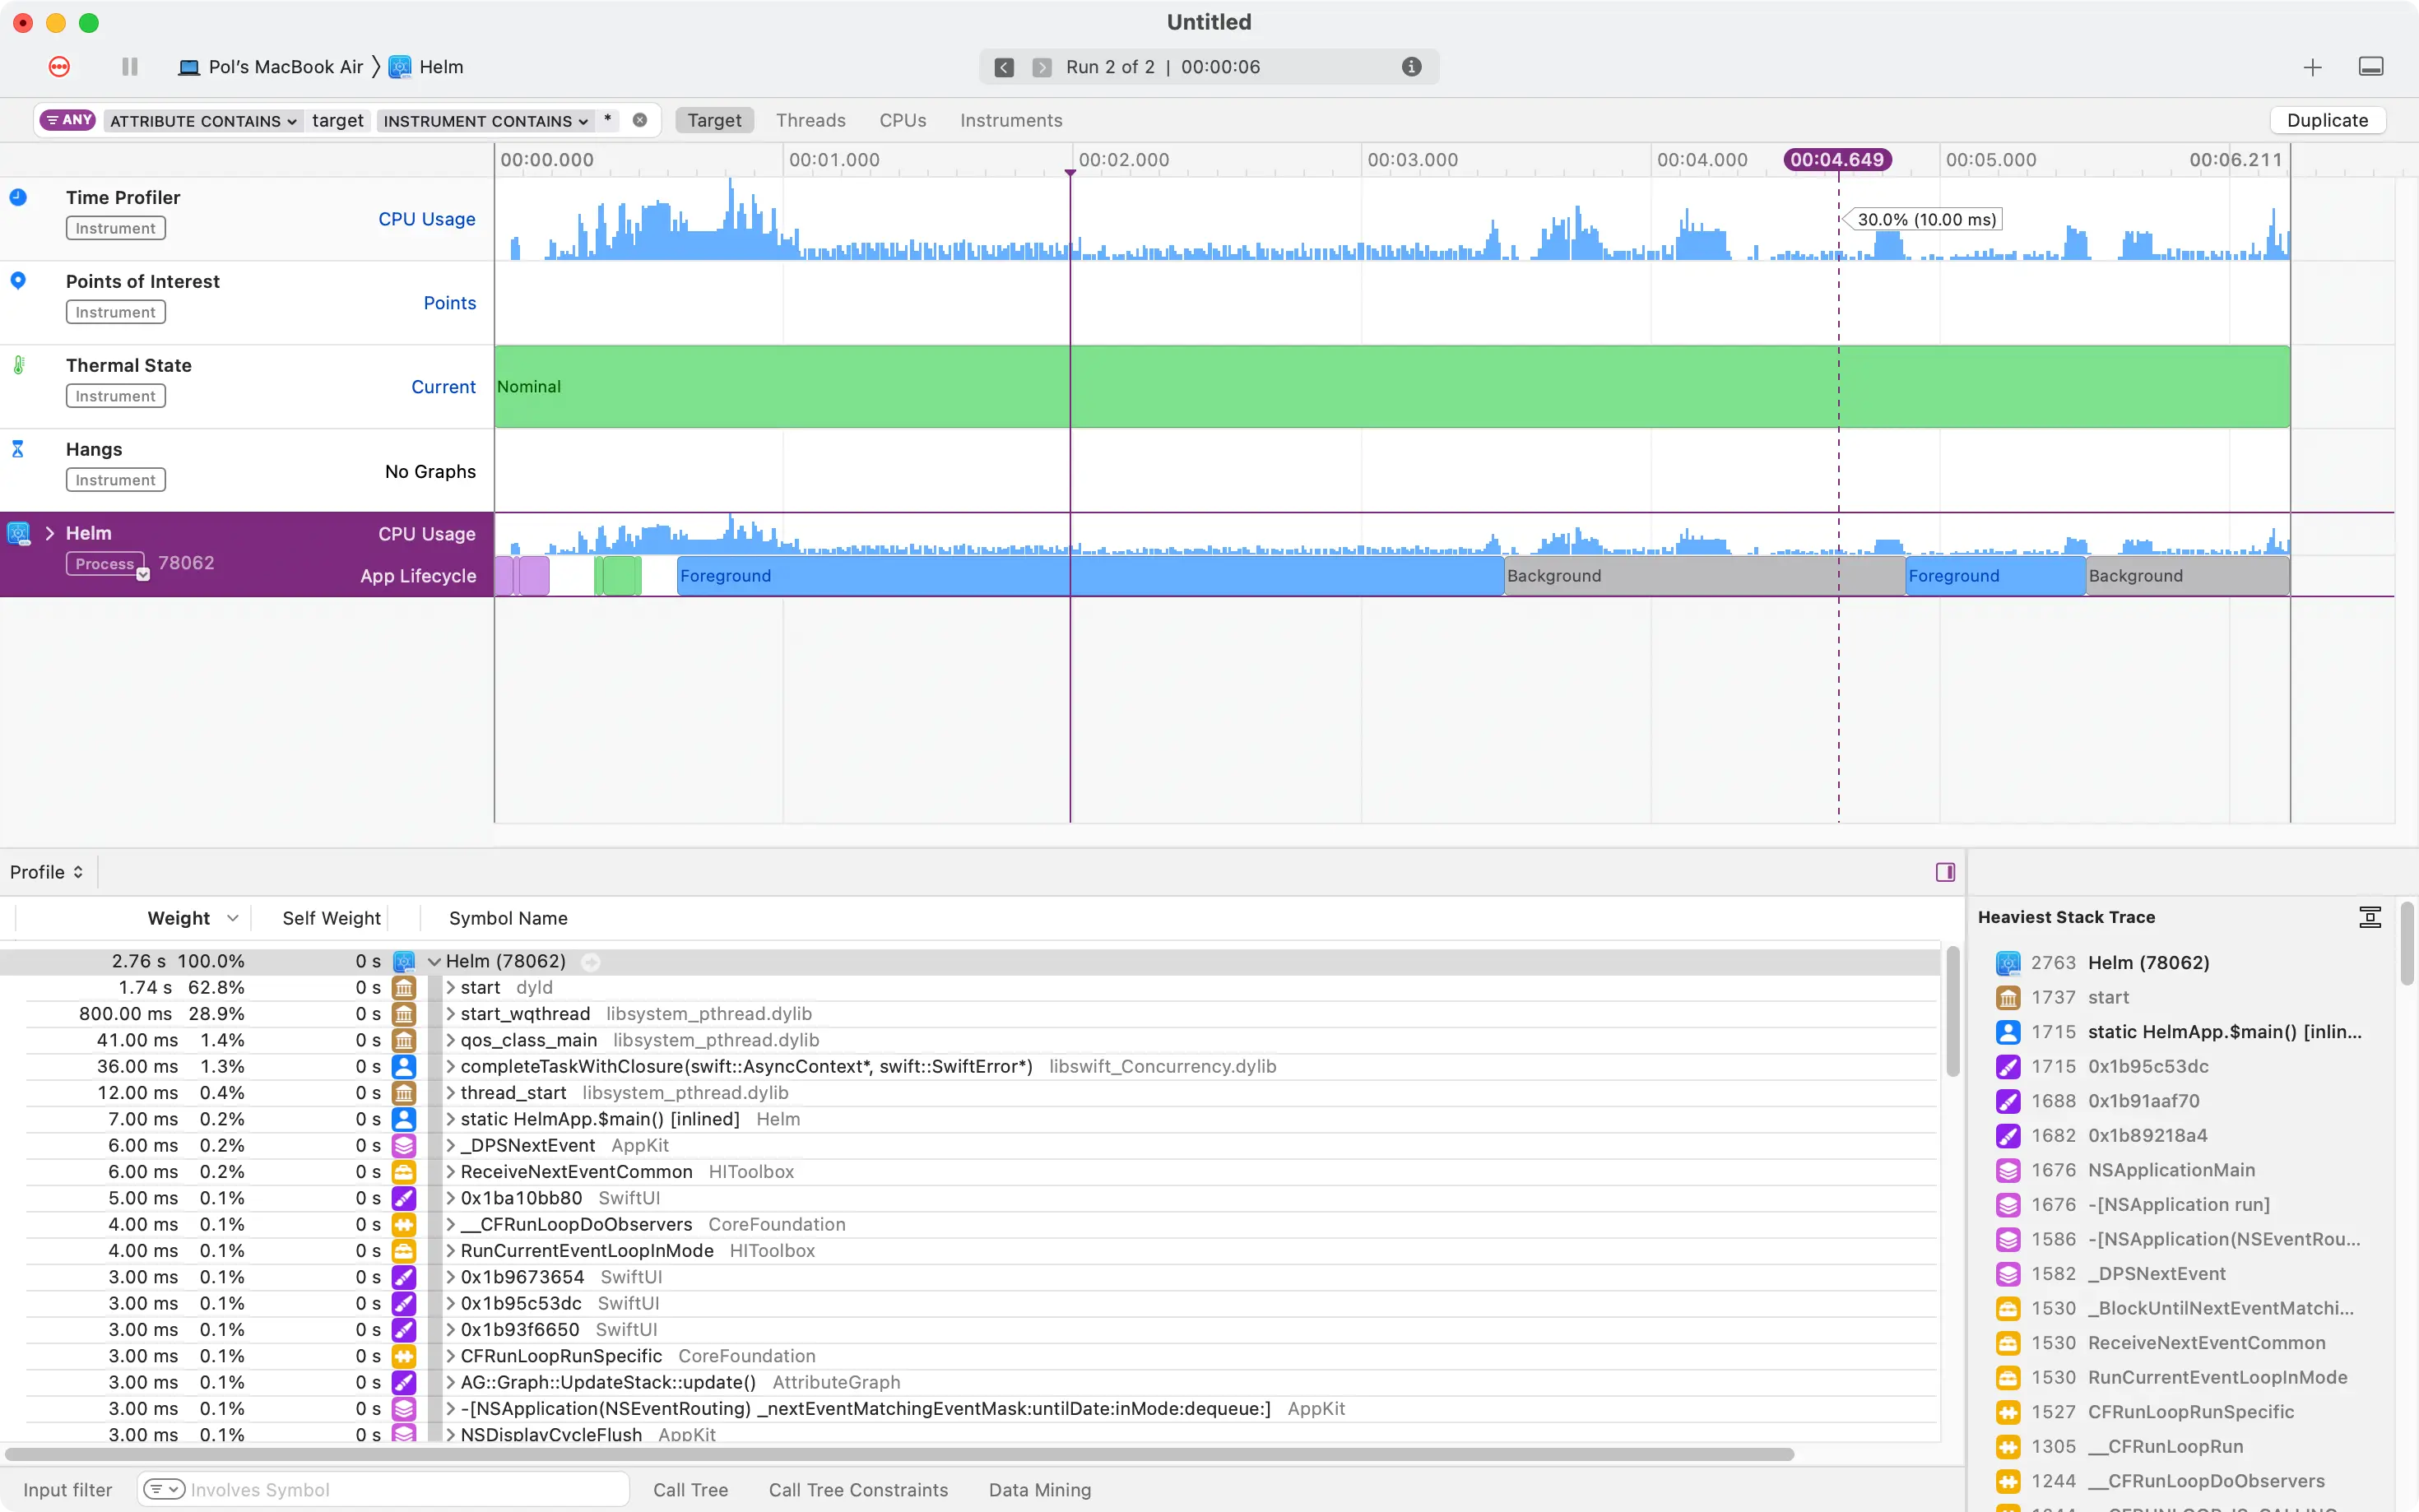
The Main Thread is responsible for updating the UI and handling user interactions. It is crucial that this thread is not blocked for long periods of time as doing so will result in issues such as unresponsive UIs, jankiness or dropped frames in animations.
Let’s see where we can find the Main Thread usage in the newly recorded trace:
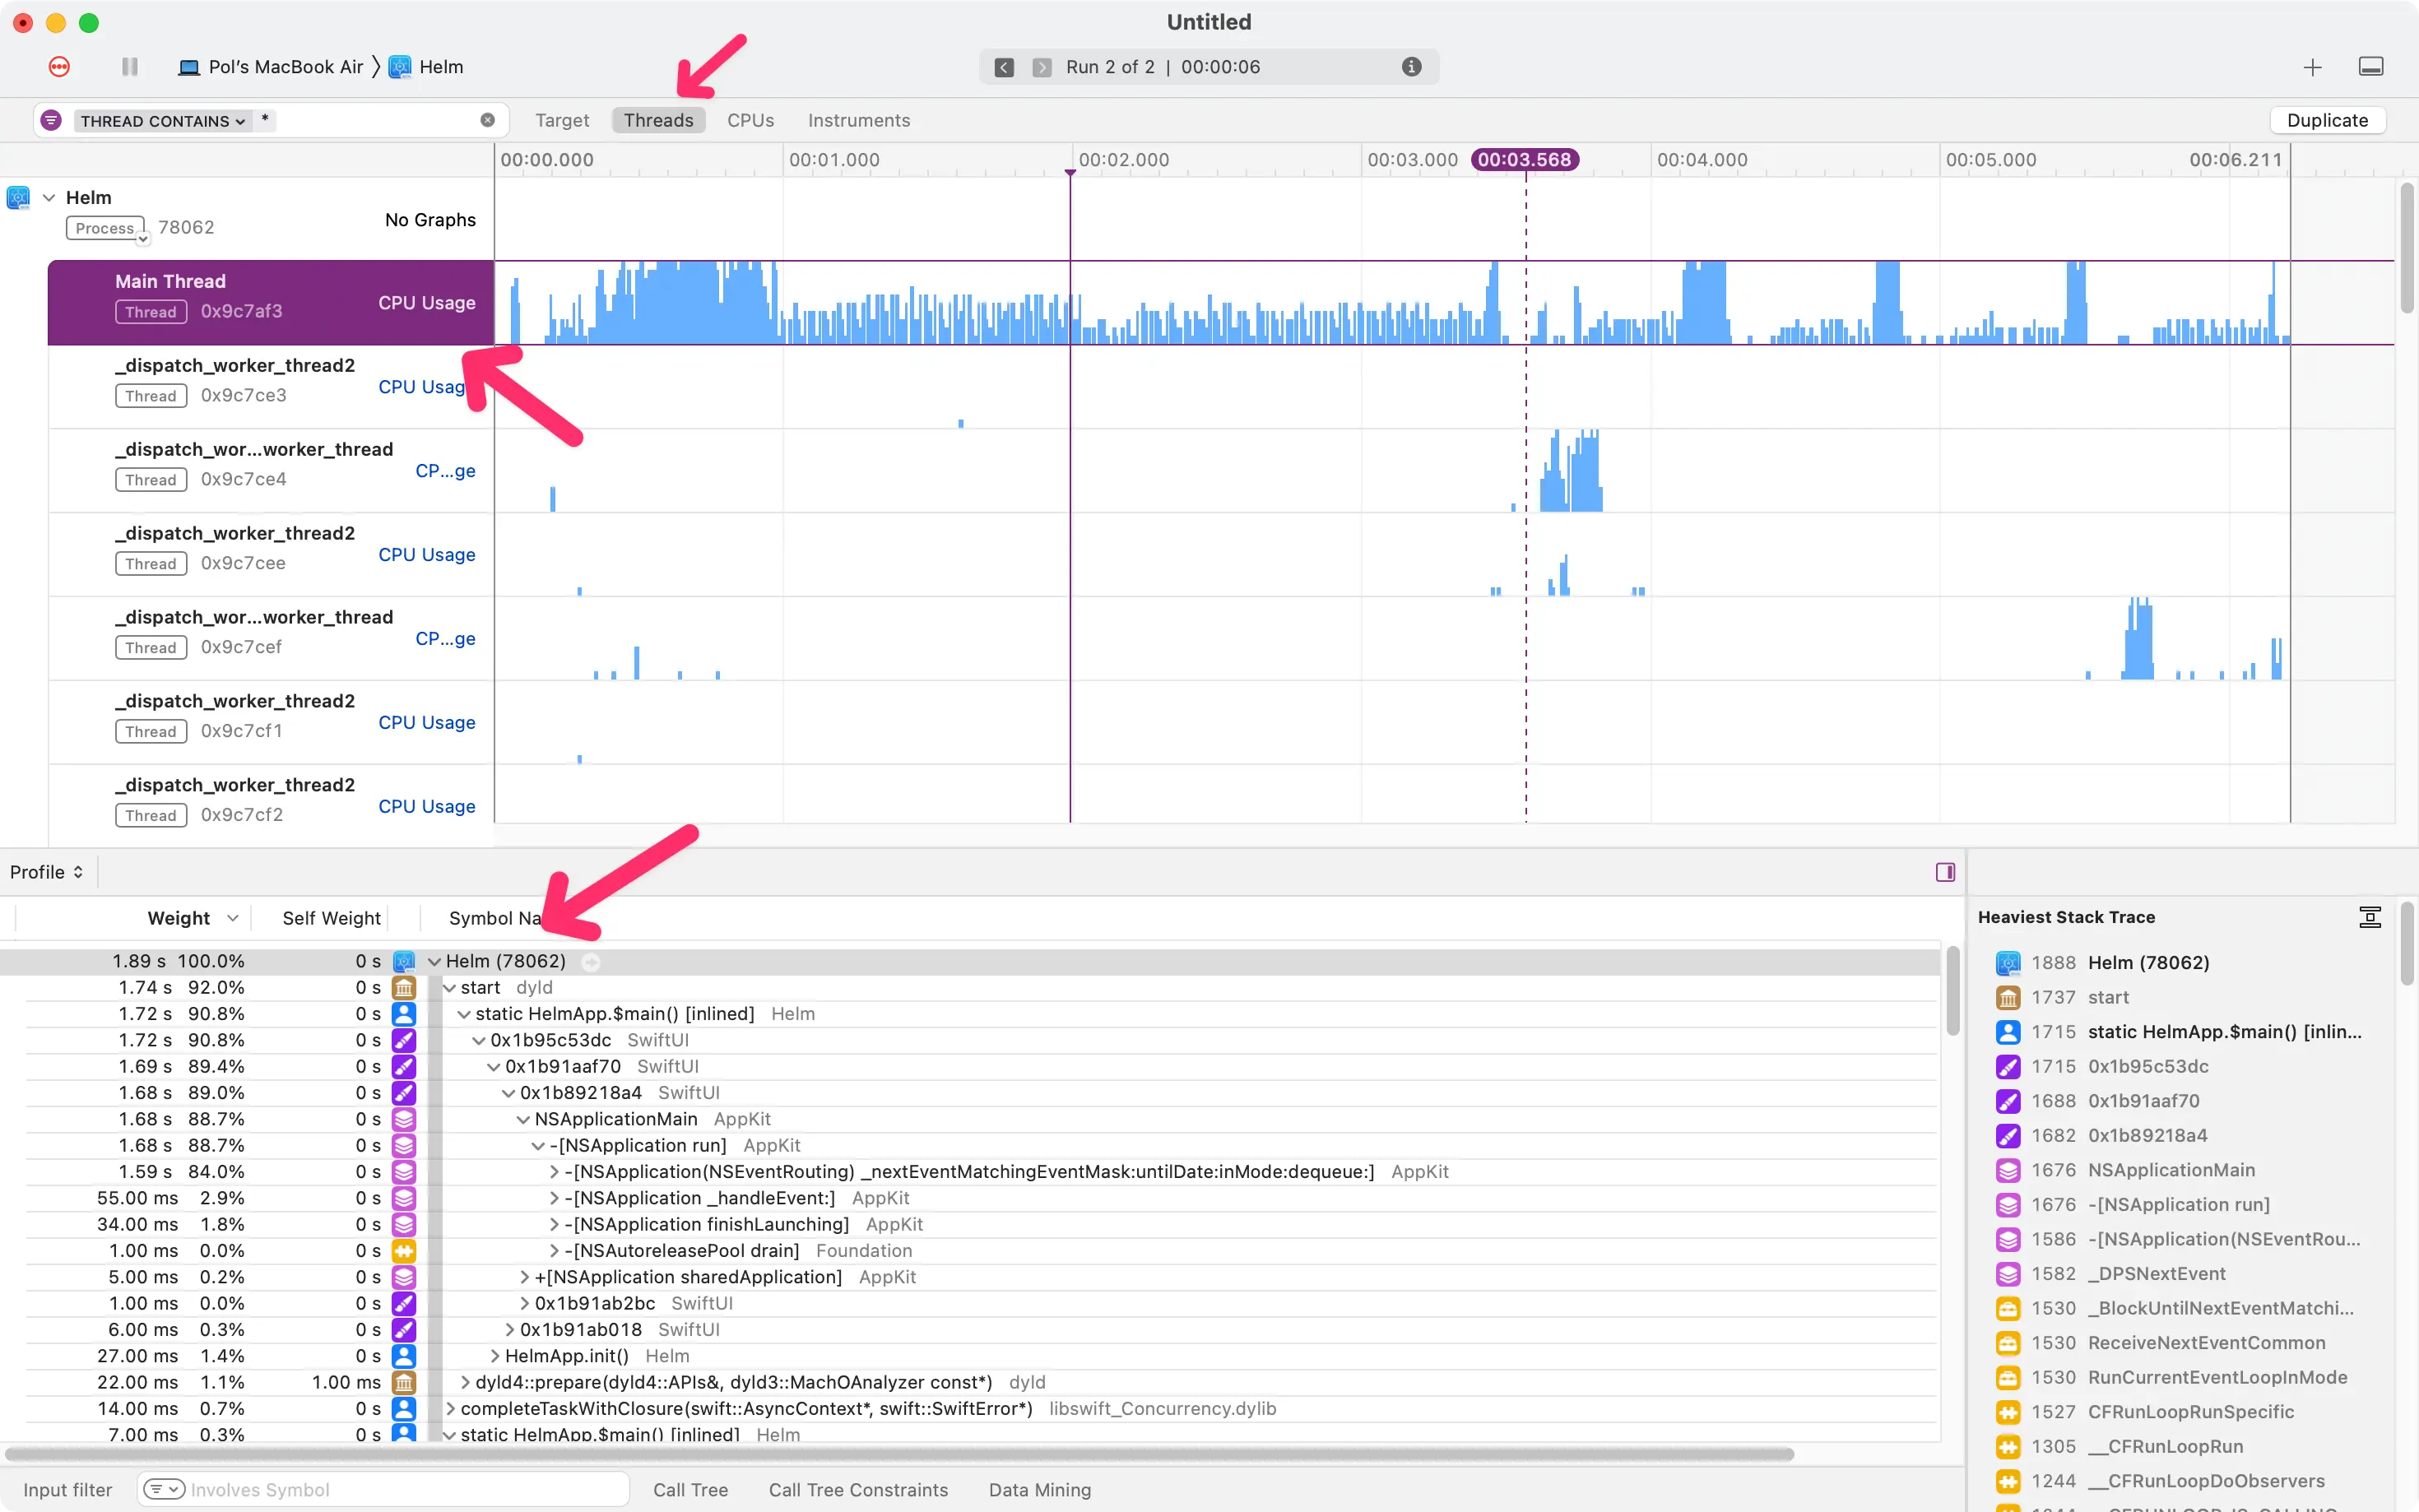
We can select the ‘Threads’ filter and then expand the relevant lane to see the Main Thread activity. In this view, you can see the Main Thread activity and focus on areas where the CPU usage is high, like this one for instance:
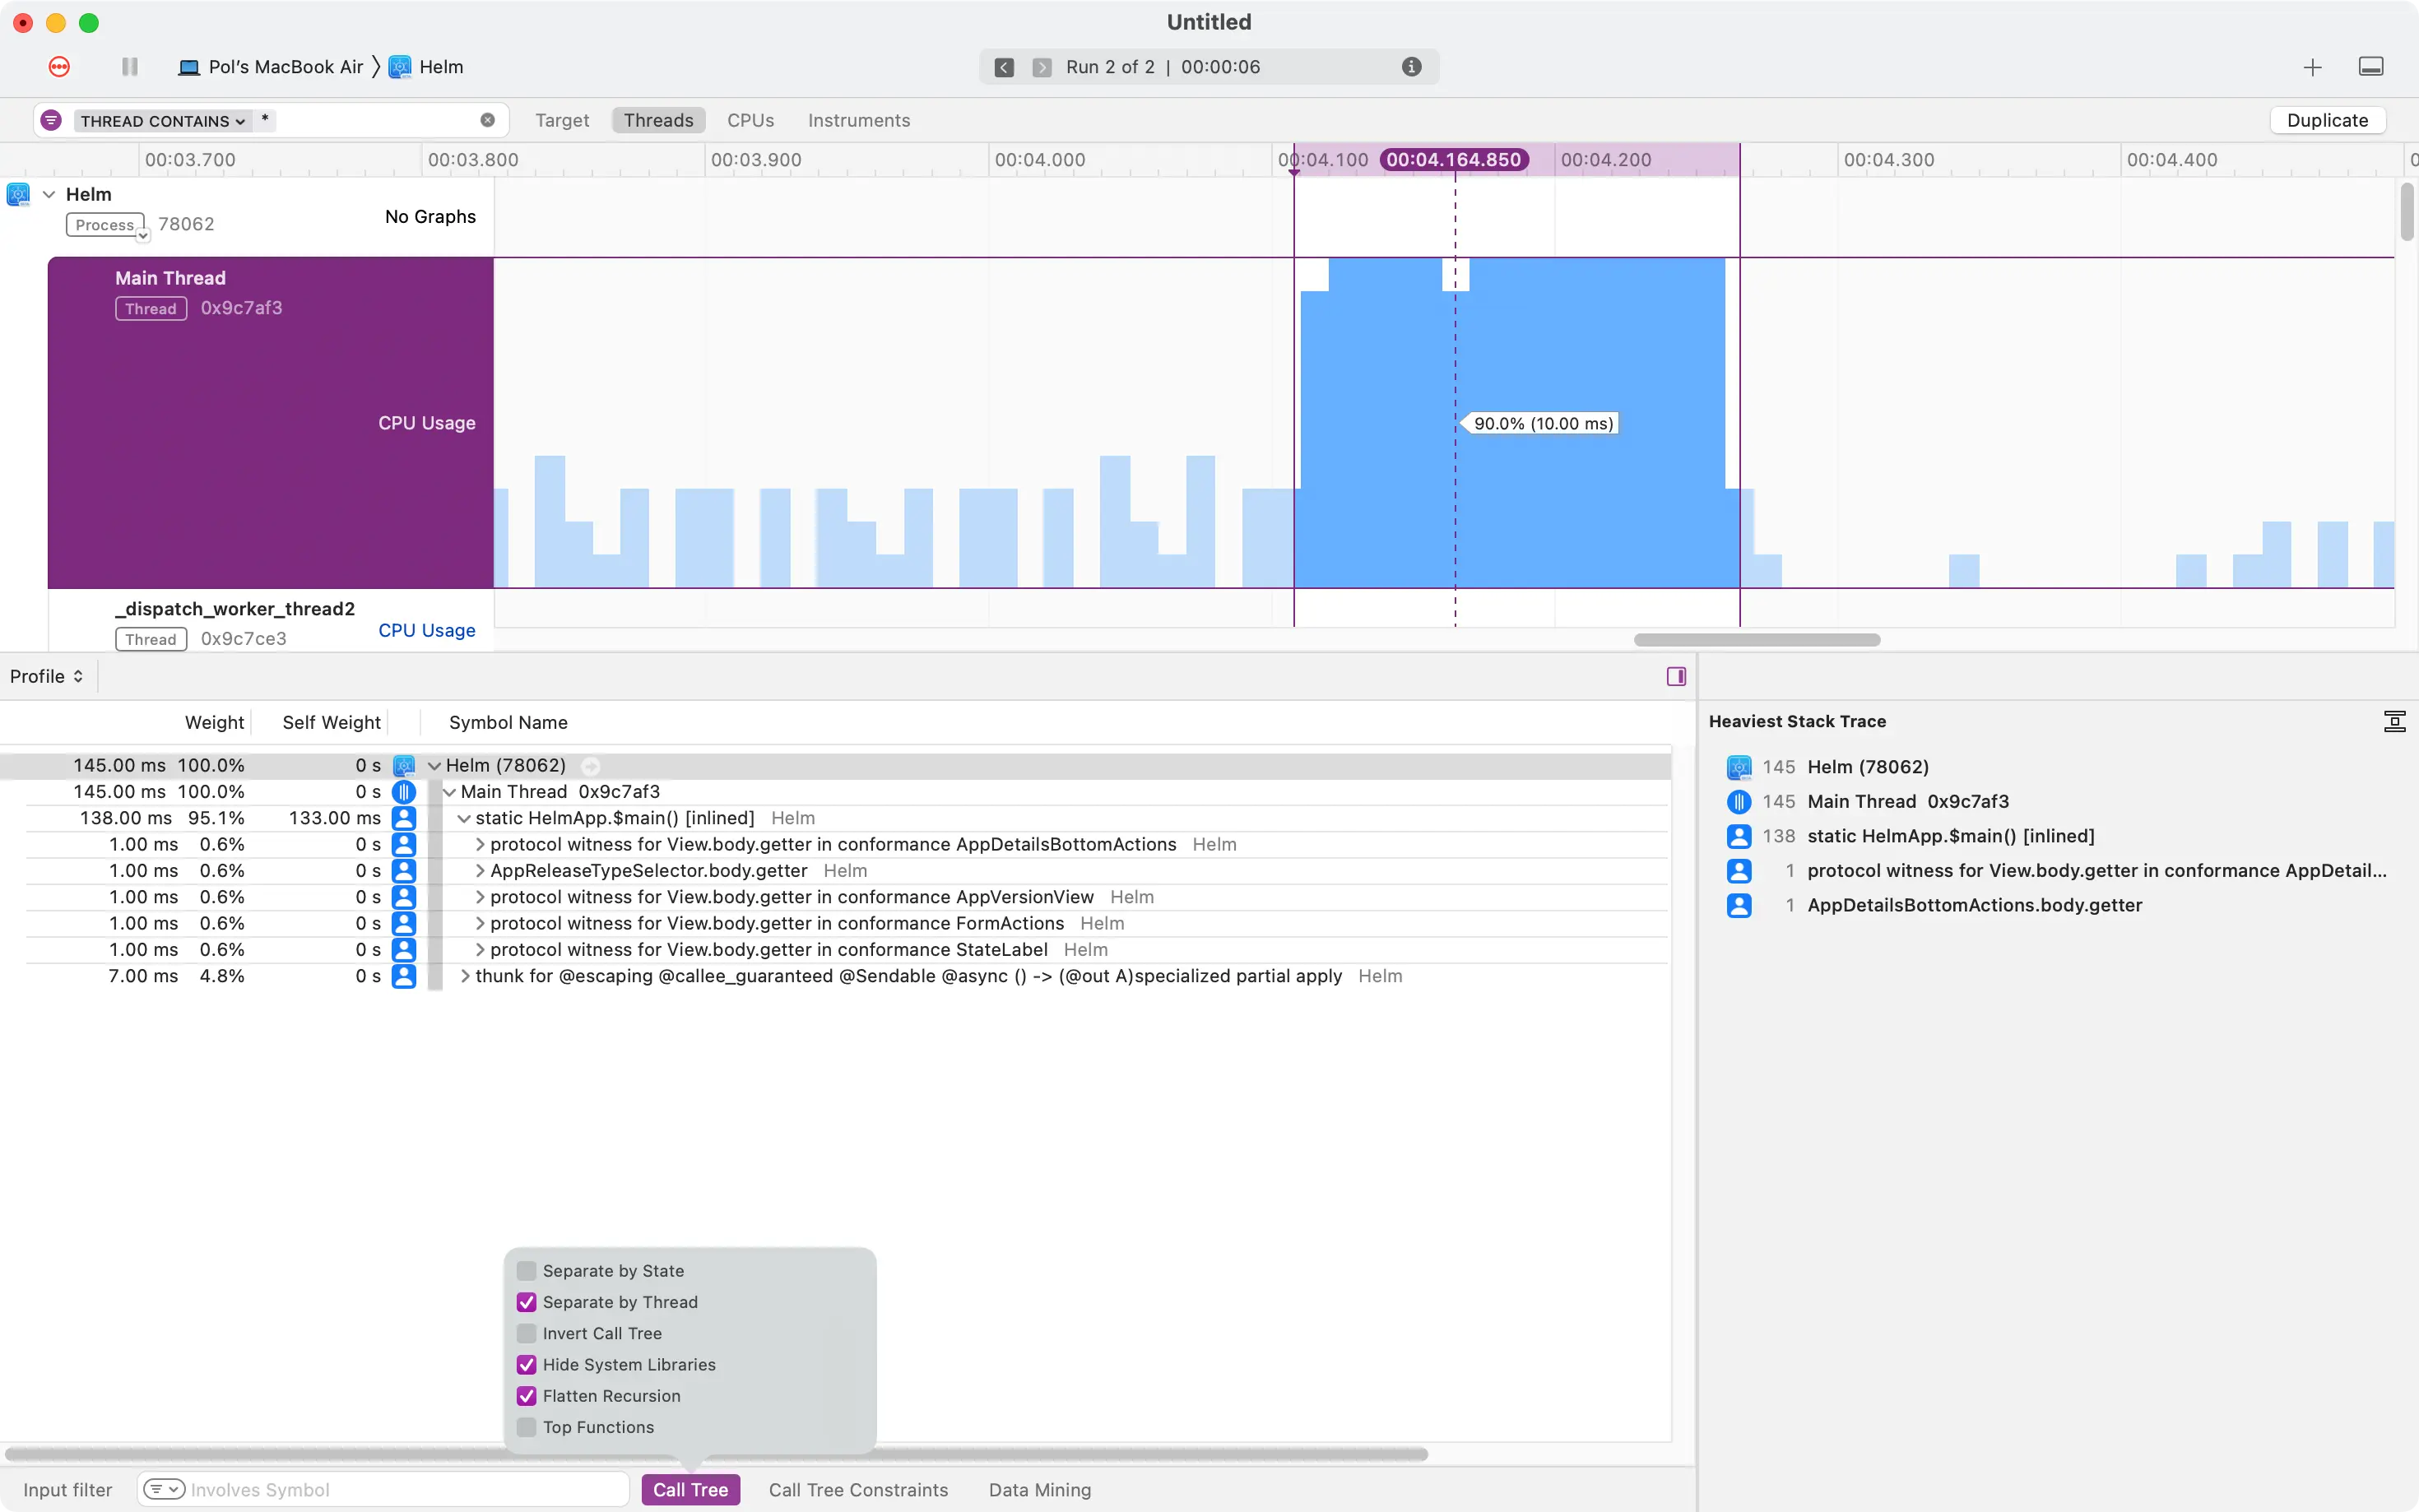
As shown in the image above, the view below the graphs will show the stack traces for the selected window of time. This is where you can identify the functions that are causing the high CPU usage and start optimizing them or even moving them to a background thread where possible.
To reduce noise from system libraries and help you achieve better focus, I recommend you tick the ‘Separate by Thread’, ‘Hide System Libraries’ and ‘Flatten Recursion’ settings from the ‘Call Tree’ menu at the bottom of the window.
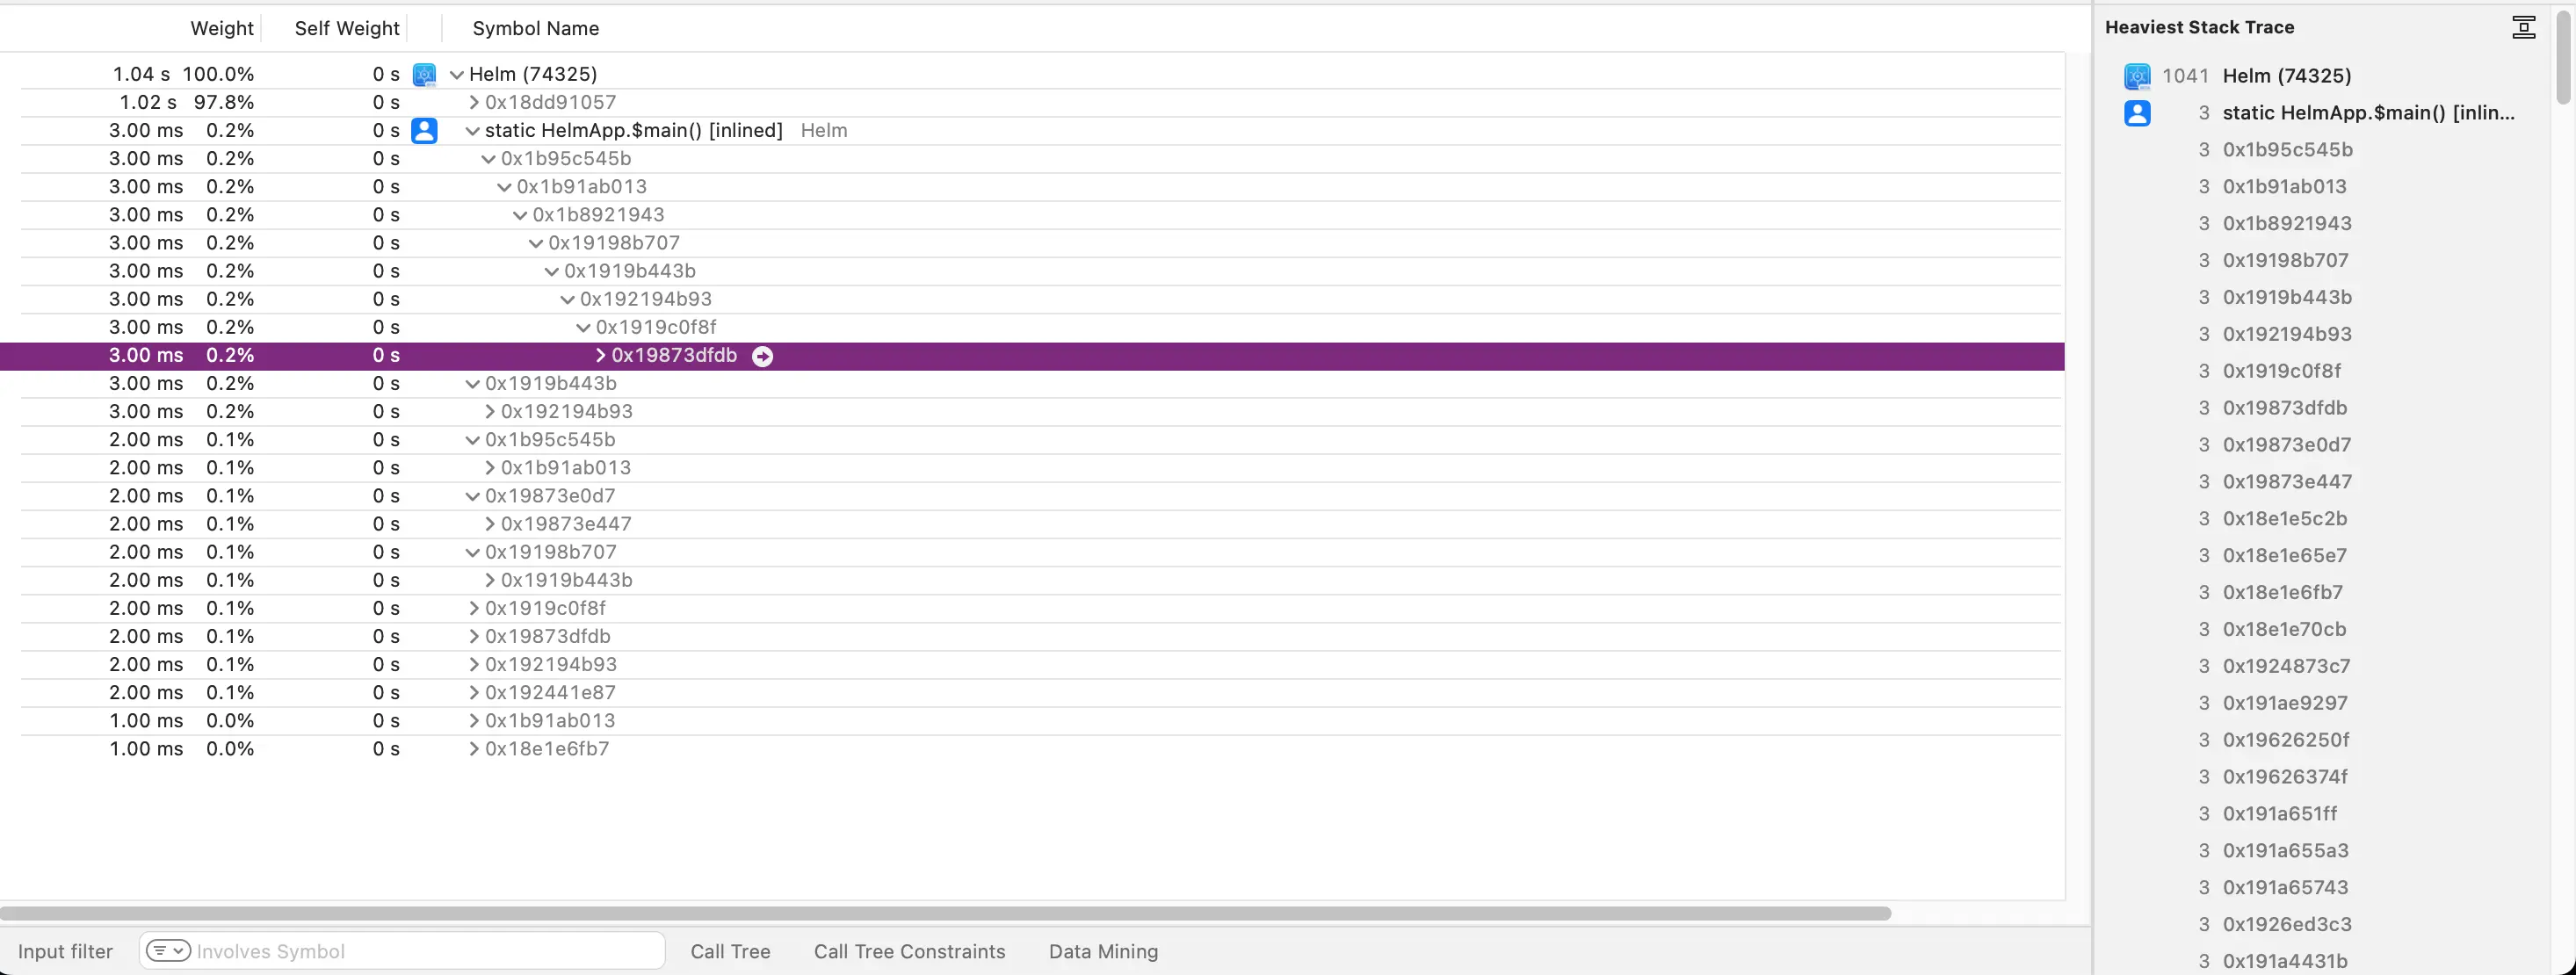
Let’s now focus on the stack trace for the selected time window and try to find areas for improvement. I always start by looking at the ‘Heaviest stack trace’ pane on the right-hand side and then find the culprit function call in the stack trace:
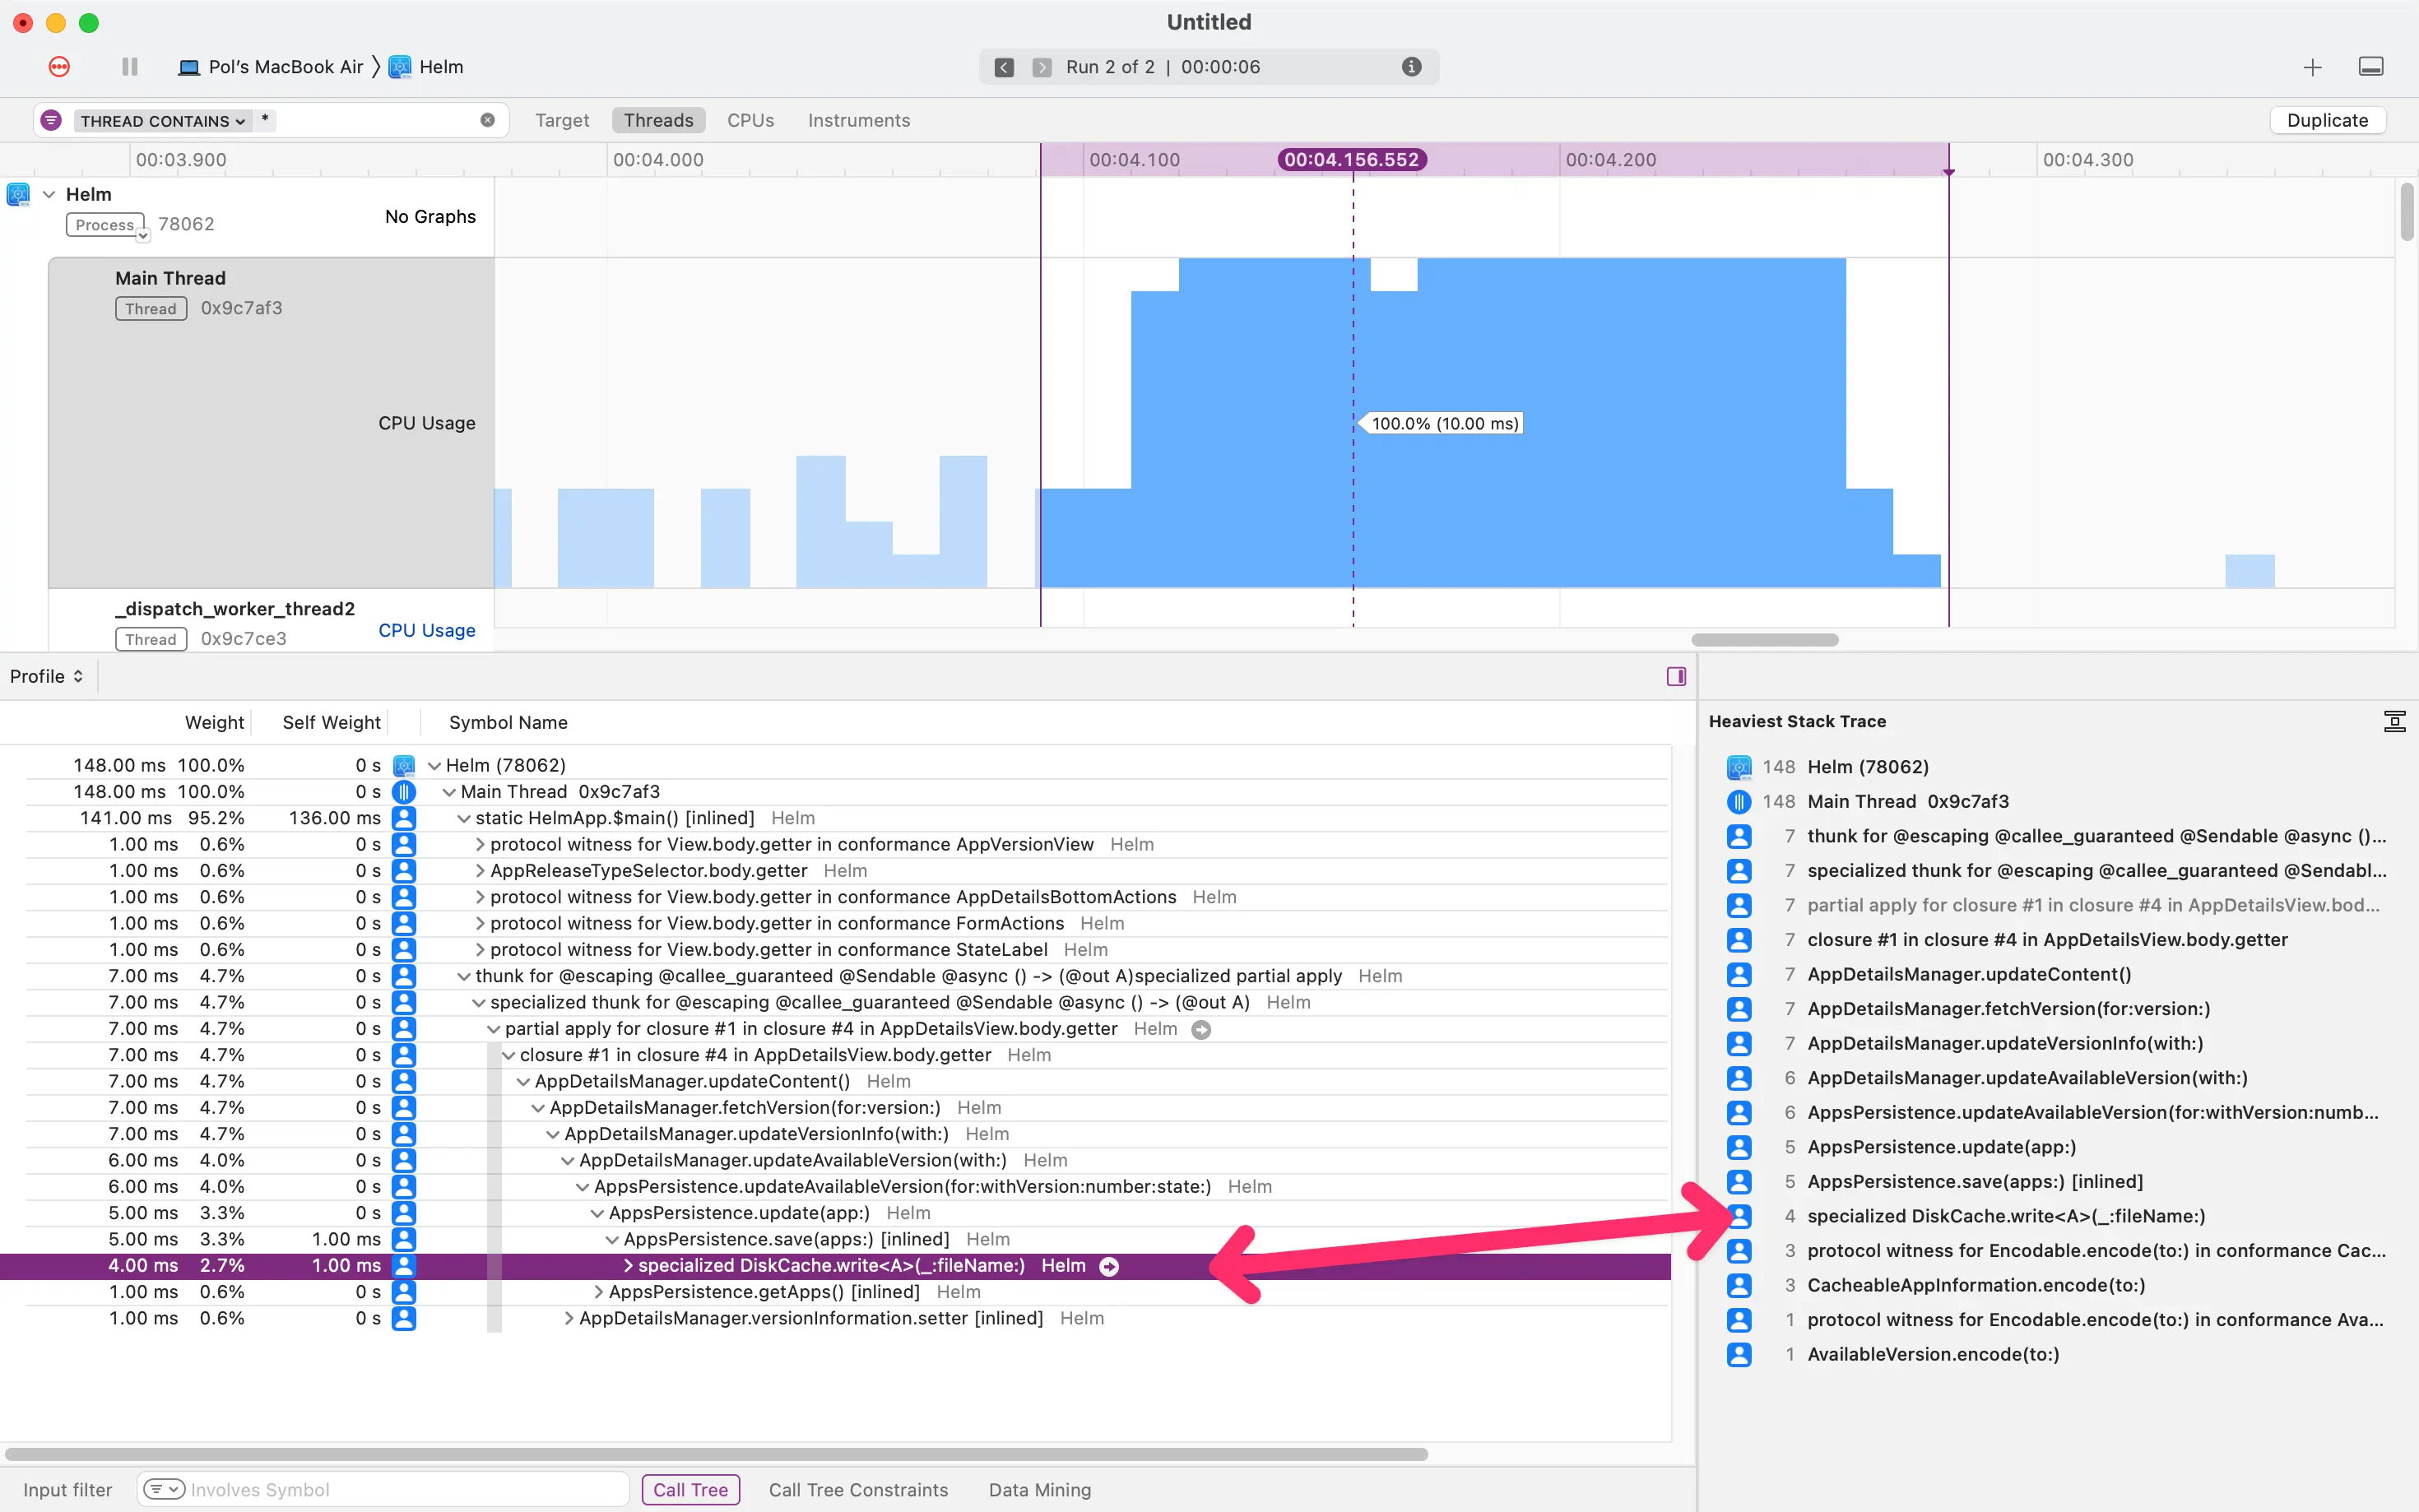
As you can see and albeit not too significant, there is a cache service that is doing work on the Main Thread, which shouldn’t be the case. One possible optimization would be to move it to a background thread.
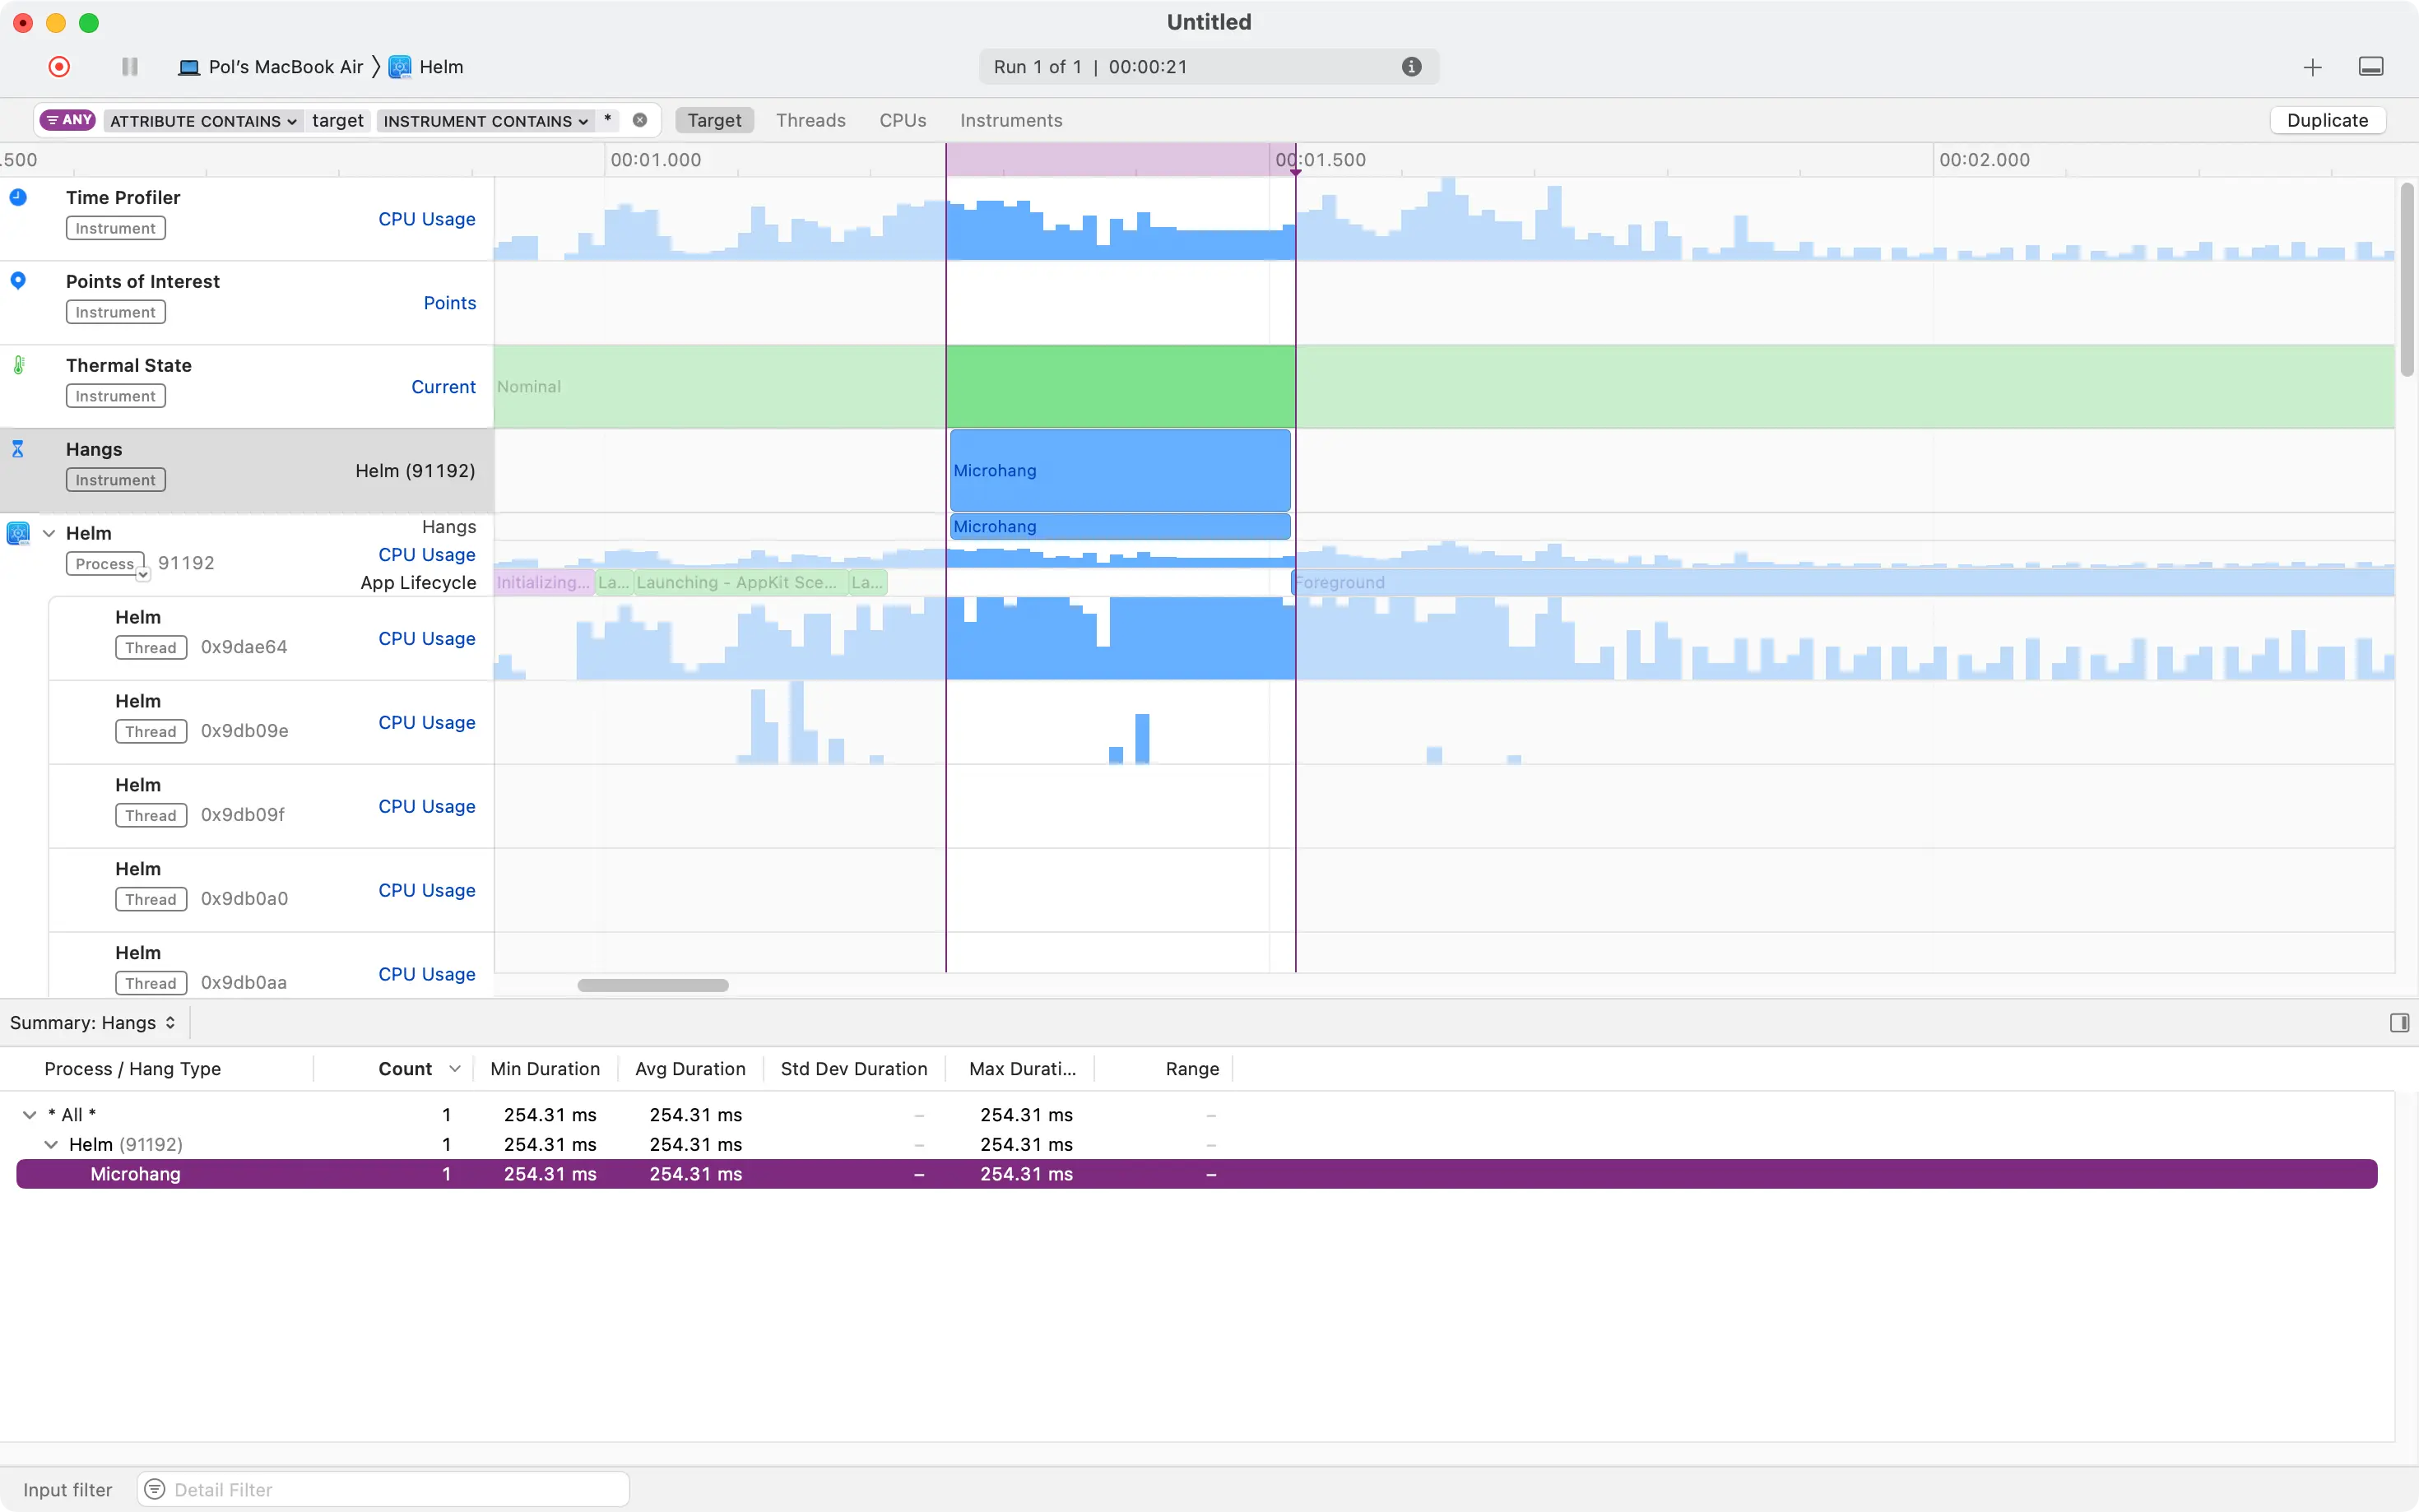
Another thing you can do when profiling your app is look at the ‘Hangs’ lane and see which portions of the stack trace in the Main Thread are causing an app hang. Identifying and fixing these issues is crucial to ensure a smooth experience for your users:
Once you have looked through all potential bottlenecks from your code, you can untick the ‘Hide System Libraries’ option and look at the system calls for optimization ideas.
Signposting
Another useful feature of instruments is the ability to add signposts to your code to help you identify areas of interest in the trace. This is particularly useful when you have a lot of similar calls and you want to differentiate them in the trace or want to measure the time taken for a specific operation.
For example, I know that saving information is a complex and time-consuming operation in my app, as it involves making a call to the backend, updating a bunch of in-memory models and saving data to disk.
To better understand the time taken for this operation and have visual feedback in the trace, I can create an instance of OSSignposter and record an interval:
private func saveInformation() async throws {
    guard let app,
            let ascVersionInformation,
            let bundleId = Bundle.main.bundleIdentifier else {
            return
    }

    let logger = Logger(subsystem: bundleId, category: "Persistence")
    let signposter = OSSignposter(logger: logger)
    let signpostId = signposter.makeSignpostID()
    let state = signposter.beginInterval("saveData", id: signpostId)
    let createdLocalizations = try await app.save(versionInformation, from: ascVersionInformation)
    signposter.emitEvent("Saved on the back end", id: signpostId)
    self.ascVersionInformation = versionInformation
    updateAvailableVersion(with: versionInformation)
    signposter.endInterval("saveData", state)
}
Now, you can profile a scheme of your app again with the time profiler instrument and add an os_signpost lane to see the events come in:
You can find the specific signpost for your logger in the ‘Signposts’ section of the trace and, as you hover over it, you will get visual feedback of how long the recorded interval took:
